Multivariate > Cluster > Hierarchical
Determine the appropriate number of segments
The goal of Cluster Analysis is to group respondents (e.g., consumers) into segments based on needs, benefits, and/or behaviors. The tool tries to achieve this goal by looking for respondents that are similar, putting them together in a cluster or segment, and separating them from other, dissimilar, respondents. The researcher compares the segments and provides a descriptive label for each.
Example: Toothpaste
First, go to the Data > Manage tab, select examples from the Load data of type dropdown, and press the Load examples button. Then select the toothpaste dataset. The dataset contains information from 60 consumers who were asked to respond to six questions to determine their attitudes towards toothpaste. The scores shown for variables v1-v6 indicate the level of agreement with statements on a 7-point scale where 1 = strongly disagree and 7 = strongly agree.
We first establish the number of segments/clusters in the data using Hierarchical Cluster Analysis. Ward’s method with Squared Euclidean distance is often used to determine how (dis)similar individuals are. These are the default values in Radiant but they can be changed if desired. The most important information from this analysis is provide by the plots, so we will focus our attention there.
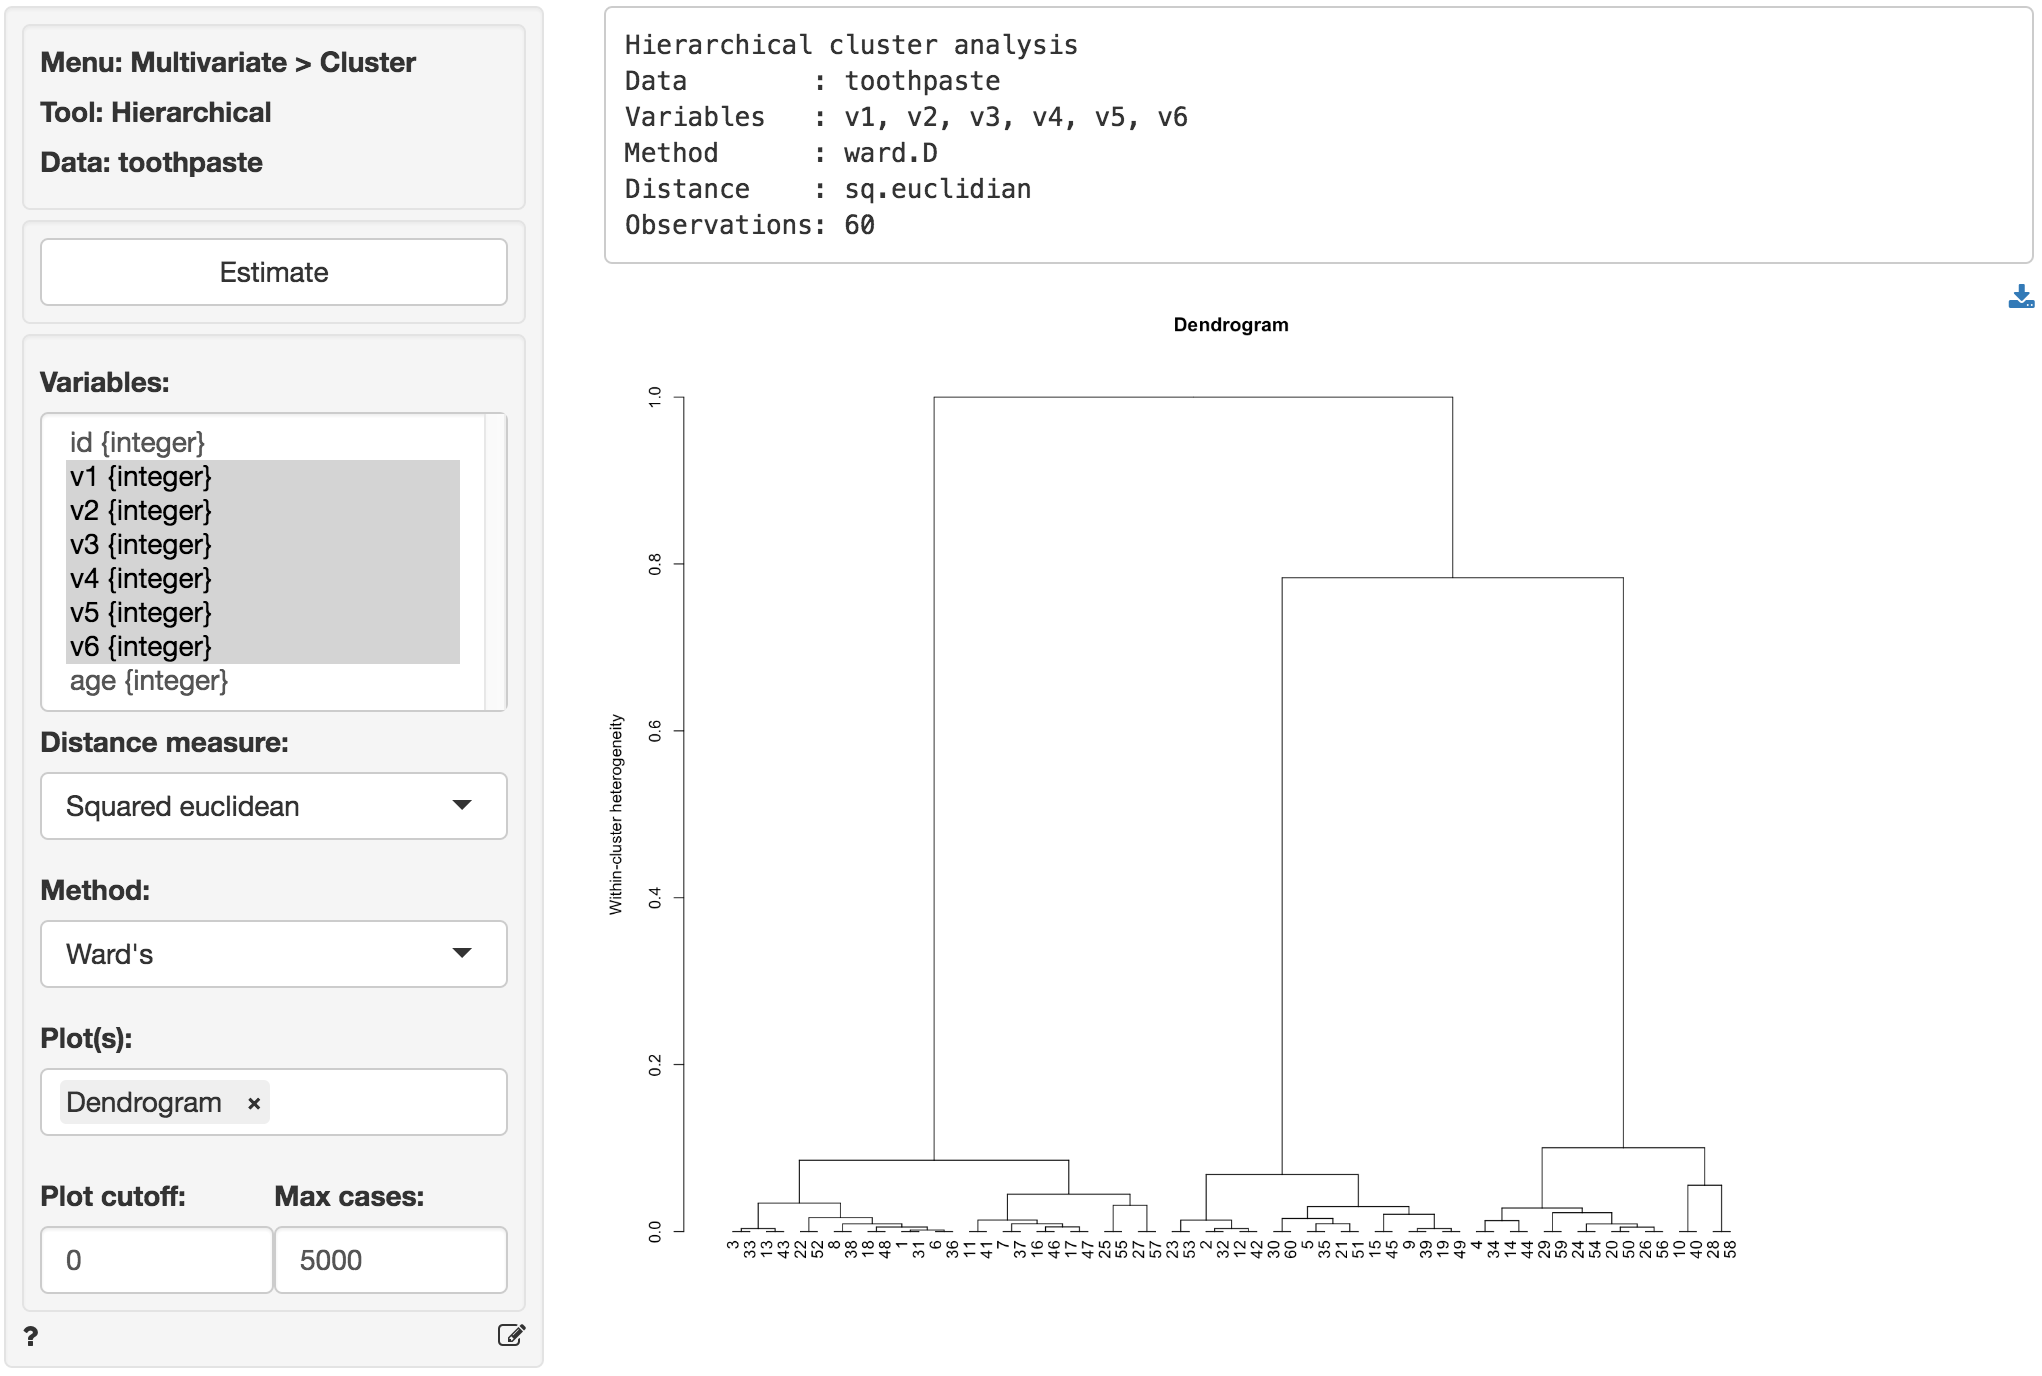
Select variables v1 through v6 in the Variables box and click the Estimate button. Note that Hierarchical Cluster Analysis can be time-consuming and memory intensive for large datasets. If your dataset has more than 5,000 observations make sure to increase the value in the Max cases input to the appropriate number. The Dendrogram shown below provides information to help you determine the most appropriate number of clusters (or segments).
Hierarchical cluster analysis starts with many segments, as many as there are respondents, and in a stepwise (i.e., hierarchical) process adds the most similar respondents or groups together until only one segment remains. To determine the appropriate number of segments look for a jump along the vertical axis of the plot. At that point two dissimilar segments have been joined. The measure along the vertical axis indicates of the level of heterogeneity within the segments that have been formed. The purpose of clustering is to create homogeneous groups to avoid segments with heterogeneous characteristics, needs, etc. Since the most obvious jump in heterogeneity occurs when we go from 3 to 2 segments we choose 3 segments (i.e., we avoid creating a heterogeneous segment).
Another plot that can be used to determine the number of segments is a scree-plot. This is a plot of the within-cluster heterogeneity on the vertical axis and the number of segments on the horizontal axis. Again, Hierarchical cluster analysis starts with many segments and groups respondents together until only one segments is left. The scree plot is created by selecting Scree (and Change) from the Plot(s) dropdown menu. If Plot cutoff is set to 0 we see results for all possible cluster solutions. To make the plot easier to evaluate, we can set Plot cutoff to, for example, 0.05 (i.e. show only solutions that have Within-cluster heterogeneity above 5%).
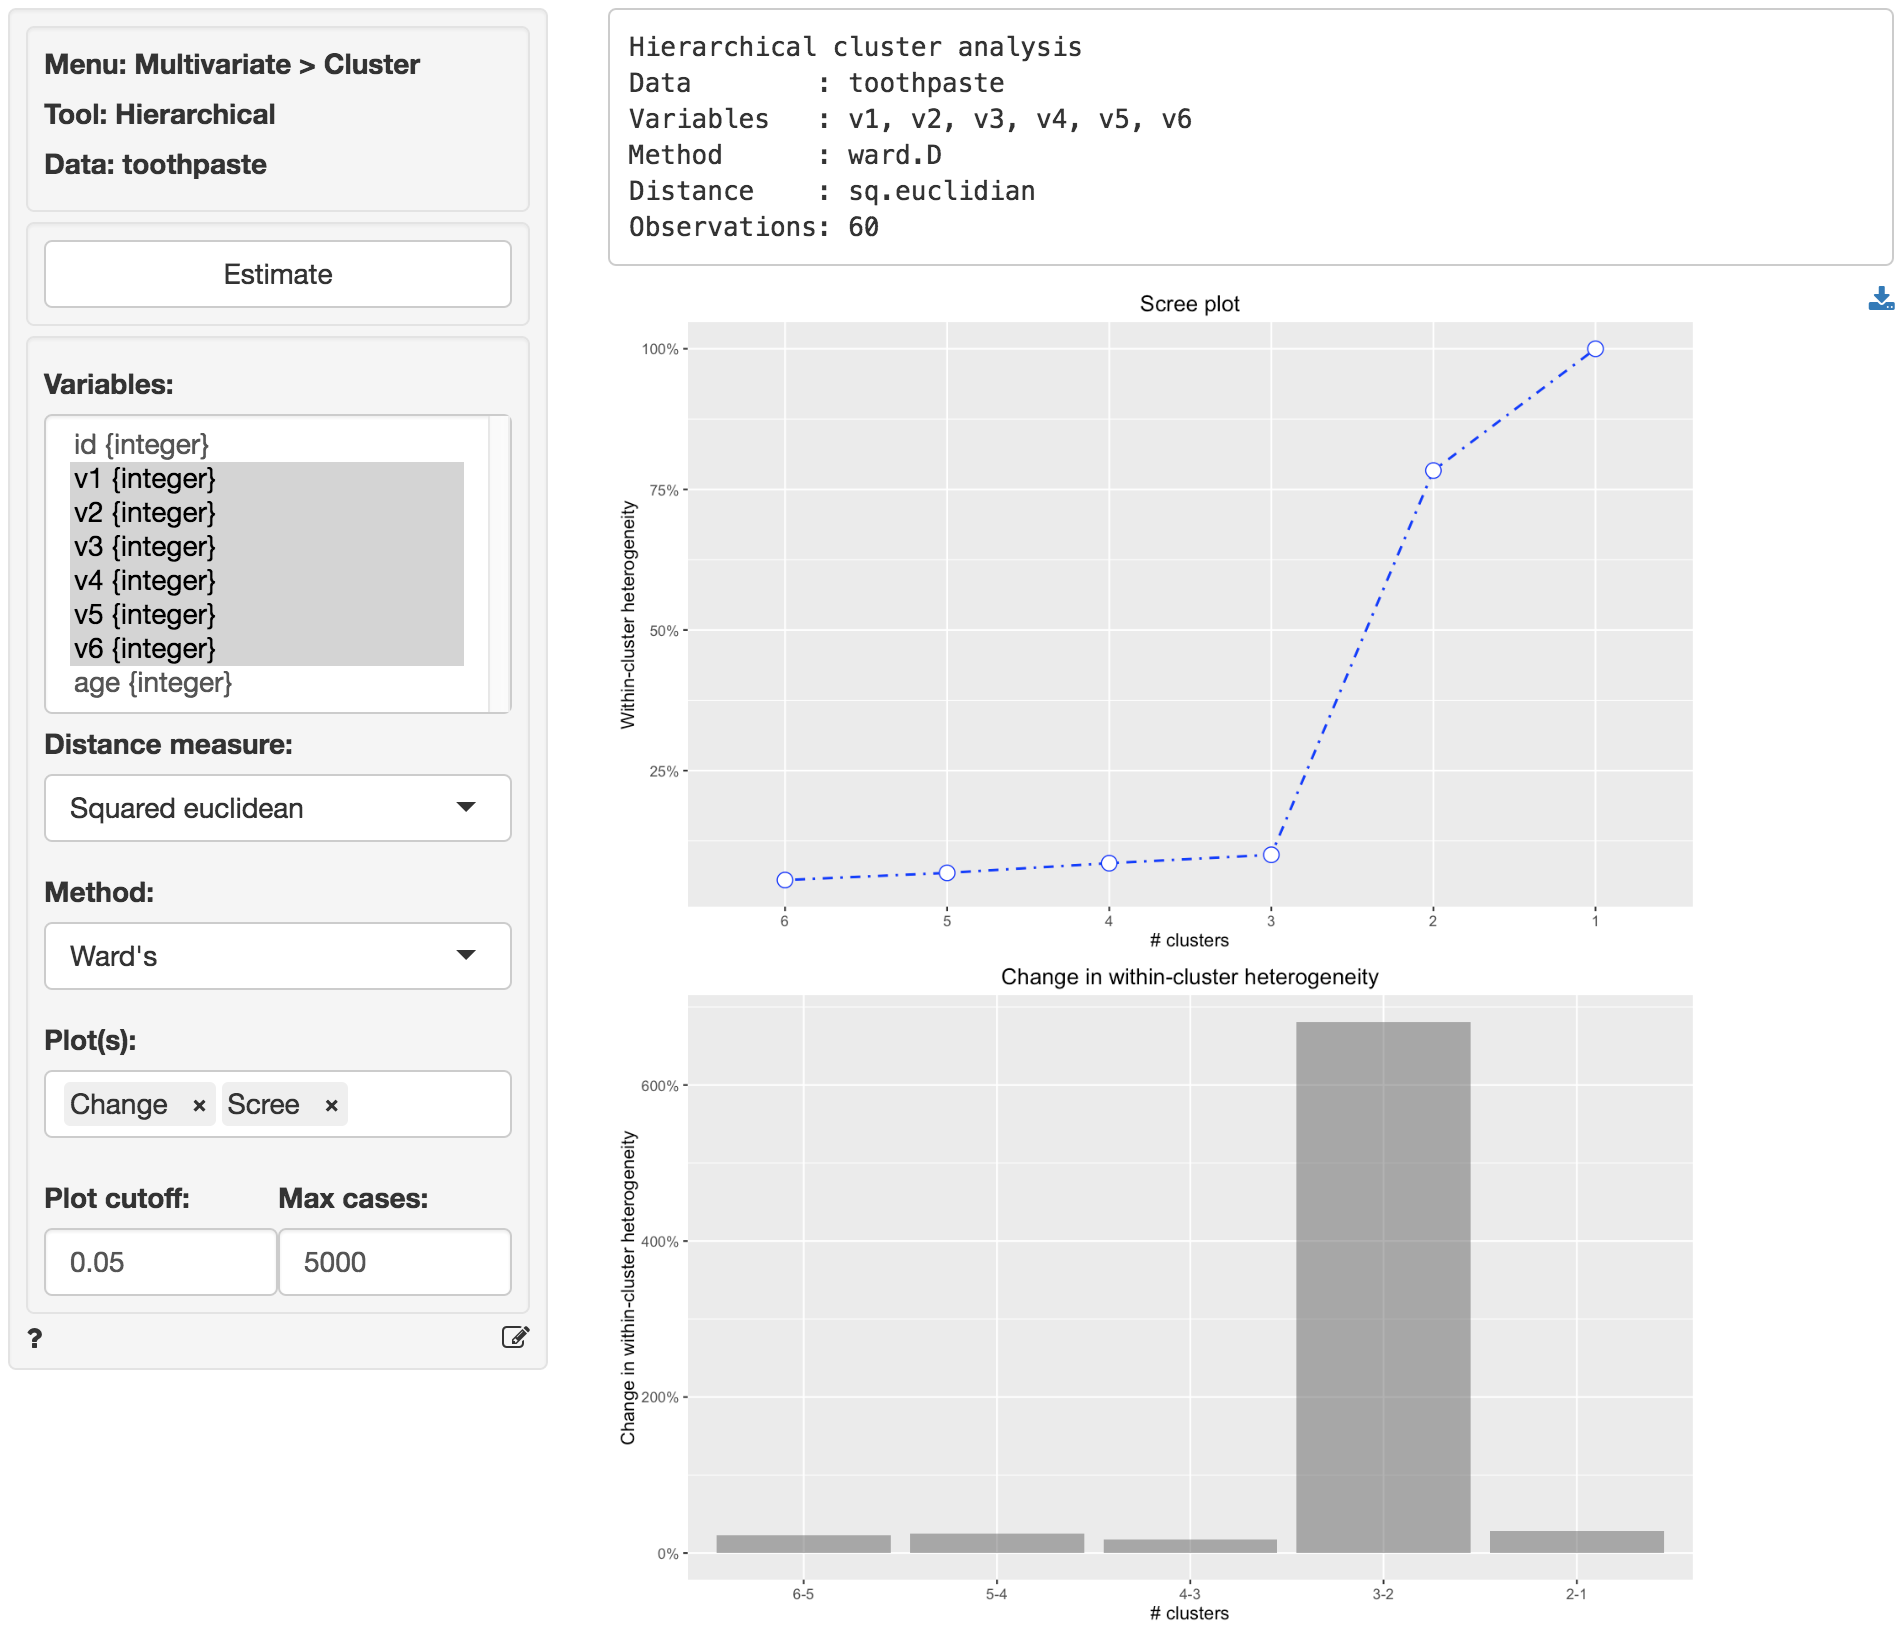
Reading the plot from left-to-right we see that within-segment heterogeneity increases sharply when we move from 3 to 2 segments. This is also clear from the Change in within-cluster heterogeneity plot (i.e., Change). To avoid creating a heterogeneous segment we, again, choose 3 segments. Now that we have determined the appropriate number of segments to extract we can use Cluster > K-means to generate the final cluster solution.
To download the plots click the download button on the top-right of the screen.
