Data > Pivot
Create pivot tables to explore your data
If you have used pivot-tables in Excel the functionality provided in the Data > Pivot tab should be familiar to you. Similar to the Data > Explore tab, you can generate summary statistics for variables in your data. You can also generate frequency tables. Perhaps the most powerful feature in Data > Pivot is that you can easily describe the data by one or more other variables.
For example, with the diamonds data loaded, select clarity and cut from the Categorical variables drop-down. The categories for the first variable will be the column headers but you can drag-and-drop the selected variables to change their ordering. After selecting these two variables a frequency table of diamonds with different levels of clarity and quality of cut is shown. Choose Row, Column, or Total from the Normalize by drop-down to normalize the frequencies by the row, column, or overall total. If a normalize option is selected it can be convenient to check the Percentage box to express the numbers as percentages. Choose Color bar or Heat map from the Conditional formatting drop-down to emphasize the highest frequency counts.
It is also possible to summarize numerical variables. Select price from the Numerical variables drop-down. This will create the table shown below. Just as in the Data > View tab you can sort the table by clicking on the column headers. You can also use sliders (e.g., click in the input box below I1) to limit the view to values in a specified range. To view only information for diamonds with Fair or Good cut quality click in the input box below the cut header.
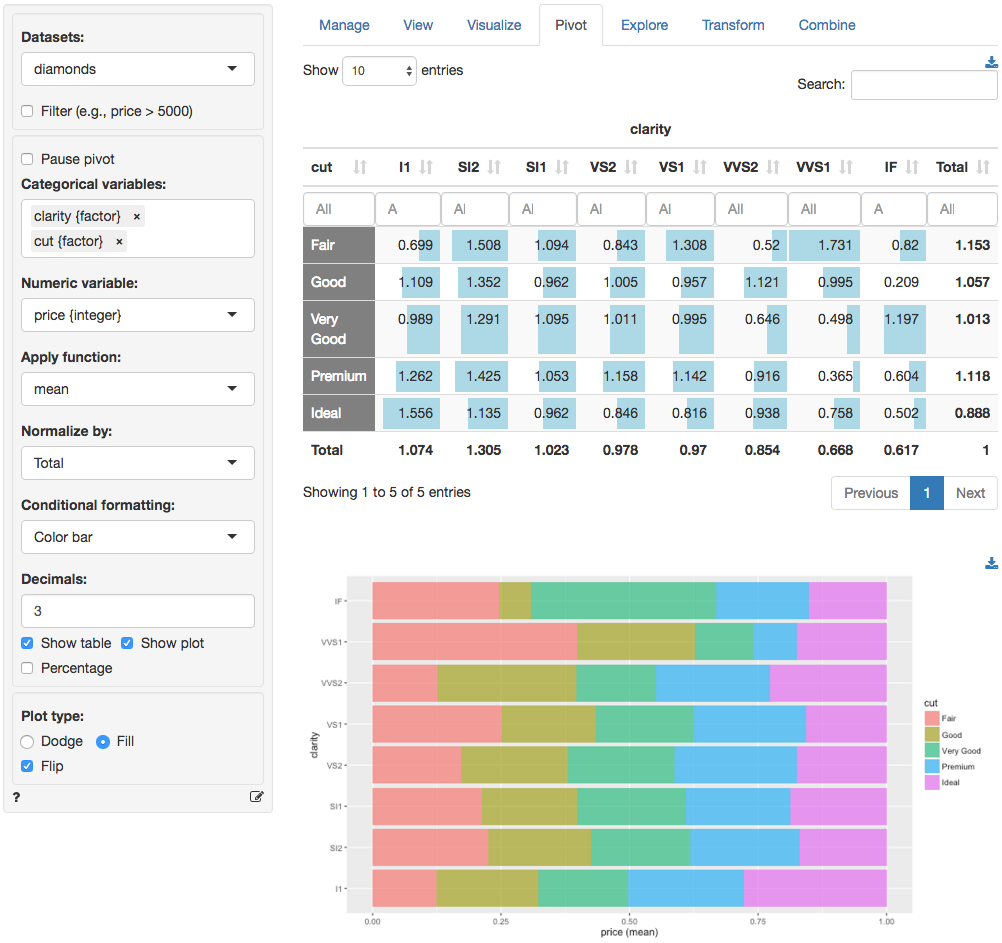
You can also create a bar chart based on the generated table (see image above). To download the table in csv format or the plot in png format click the appropriate download icon on the right.
Filter
Use the Filter box to select (or omit) specific sets of rows from the data to tabulate. See the help file for Data > View for details.
Pause pivot
For large datasets it can useful to click Pause pivot before selecting categorical and numerical variables, entering filters, etc. When you are ready to generate the pivot table make sure that Pause pivot is no longer checked. When Pause pivot is not checked, any input changes will automatically result in a new table.
