Multivariate > Conjoint > Conjoint
Analyze responses from a conjoint survey
To setup a conjoint study from scratch we need to determine the attributes and attributes levels that should be included. Once that has been done we would typically need to generate a fractional factorial design of conjoint profiles. This is a subset of all possible profiles that could be generated for the set of attributes and levels that were selected (see Design > DOE > Design of Experiments).
Once data is available from respondents their evaluations are analyzed to determine Part Worths (PW) and Importance Weights (IW).
Example: Carpet cleaner
A respondent was presented with 18 product profiles for a carpet cleaning product described on five attributes in a conjoint study (dataset: carpet.rda is part of the example datasets). The attributes are:
- design = Package Design (A, B, C)
- brand = Brand Name (K2R, Glory, Bissell)
- price = Price (1.19, 1.39, 1.59)
- seal = Good Housekeeping seal of approval (Yes or No)
- money_back = Money Back Guarantee (Yes or No)
- ranking = Respondent ranking of 18 attributes
Design characteristics:

Based on the attributes, 108 possible profiles could be created (i.e., 3x3x3x2x2 = 108). The respondent was given a select set of 18 and was asked to rank the profiles from most preferred (rank 1) to least preferred (rank 18). The first five columns represent the five attributes and the last column is the respondent’s ranking.
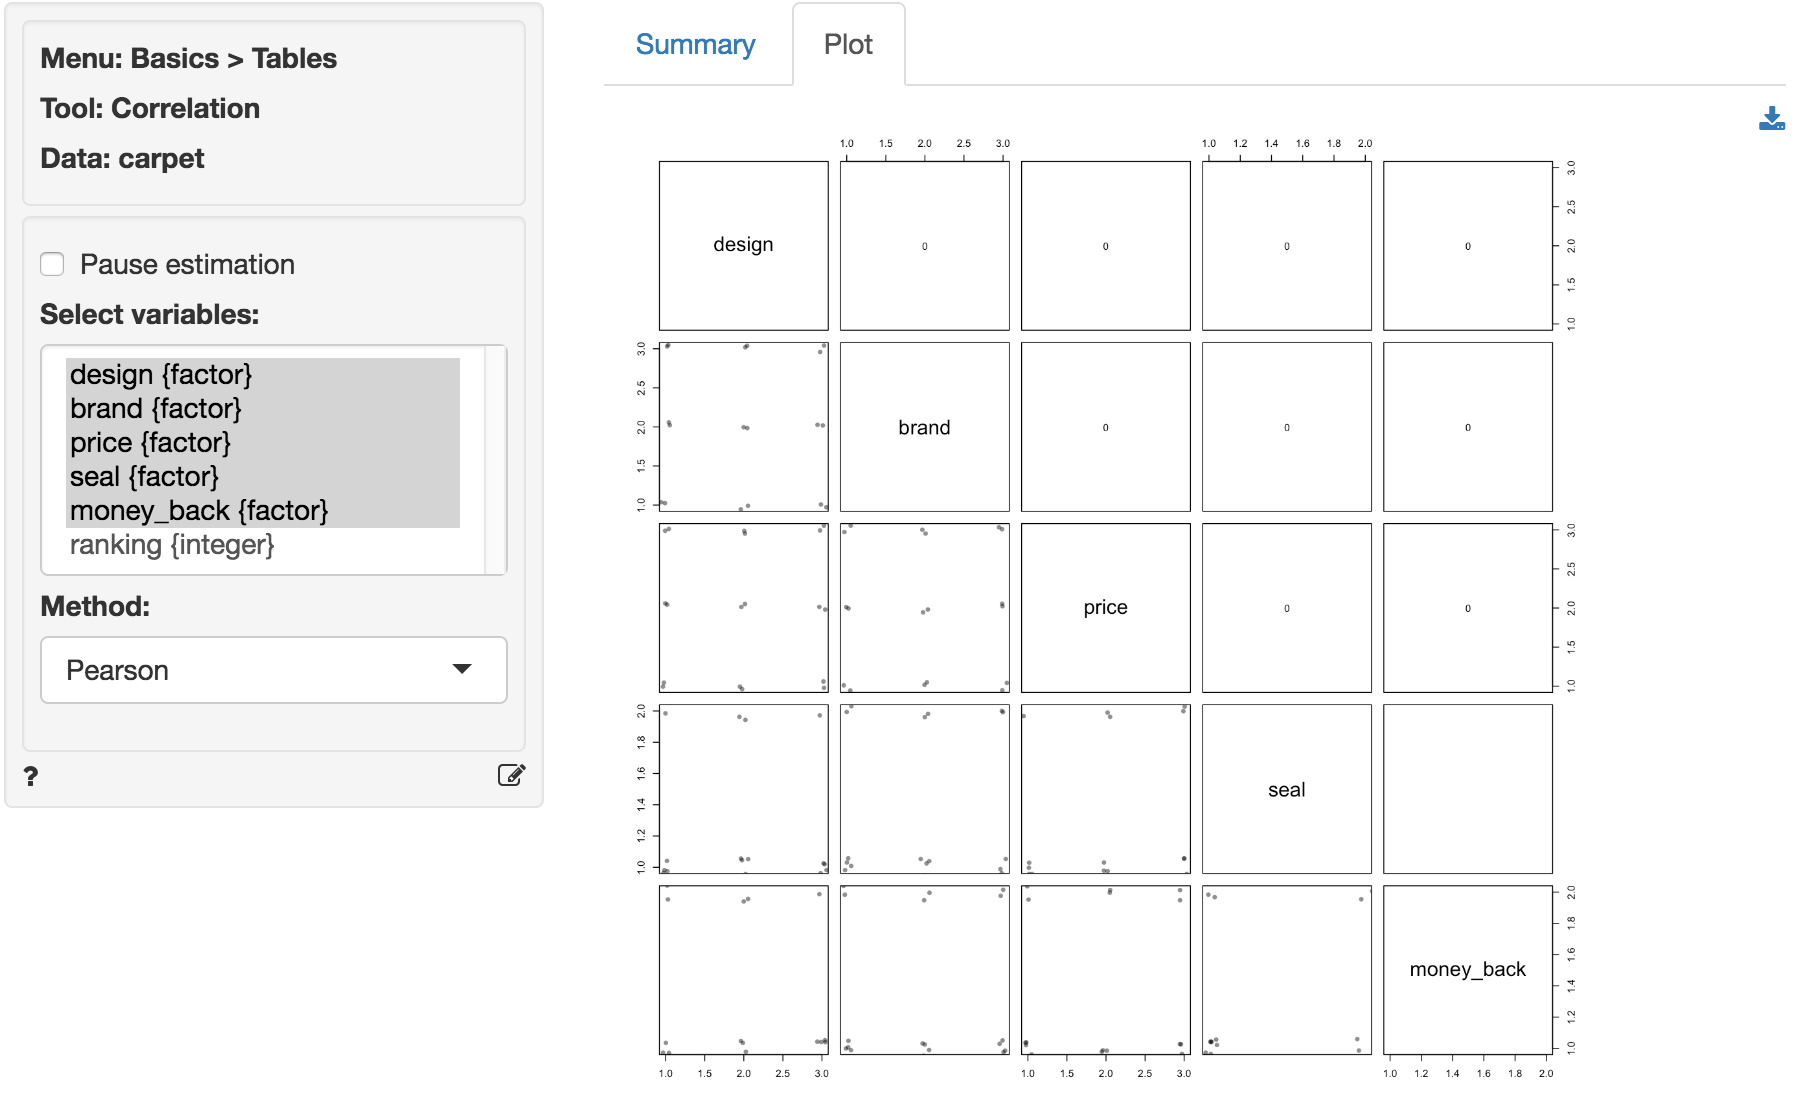
- Compute the correlation matrix for the attribute variables (see Basics > Tables > Correlation). Display the correlation matrix. What do you notice in the correlation matrix? What does this say about the particular set of 18 profiles that was presented to the respondent?
- The correlation matrix is displayed below. Note that the correlations for any two attributes are zero. In the fractional factorial design profiles are deliberately selected such that all attributes are uncorrelated (i.e., orthogonal).
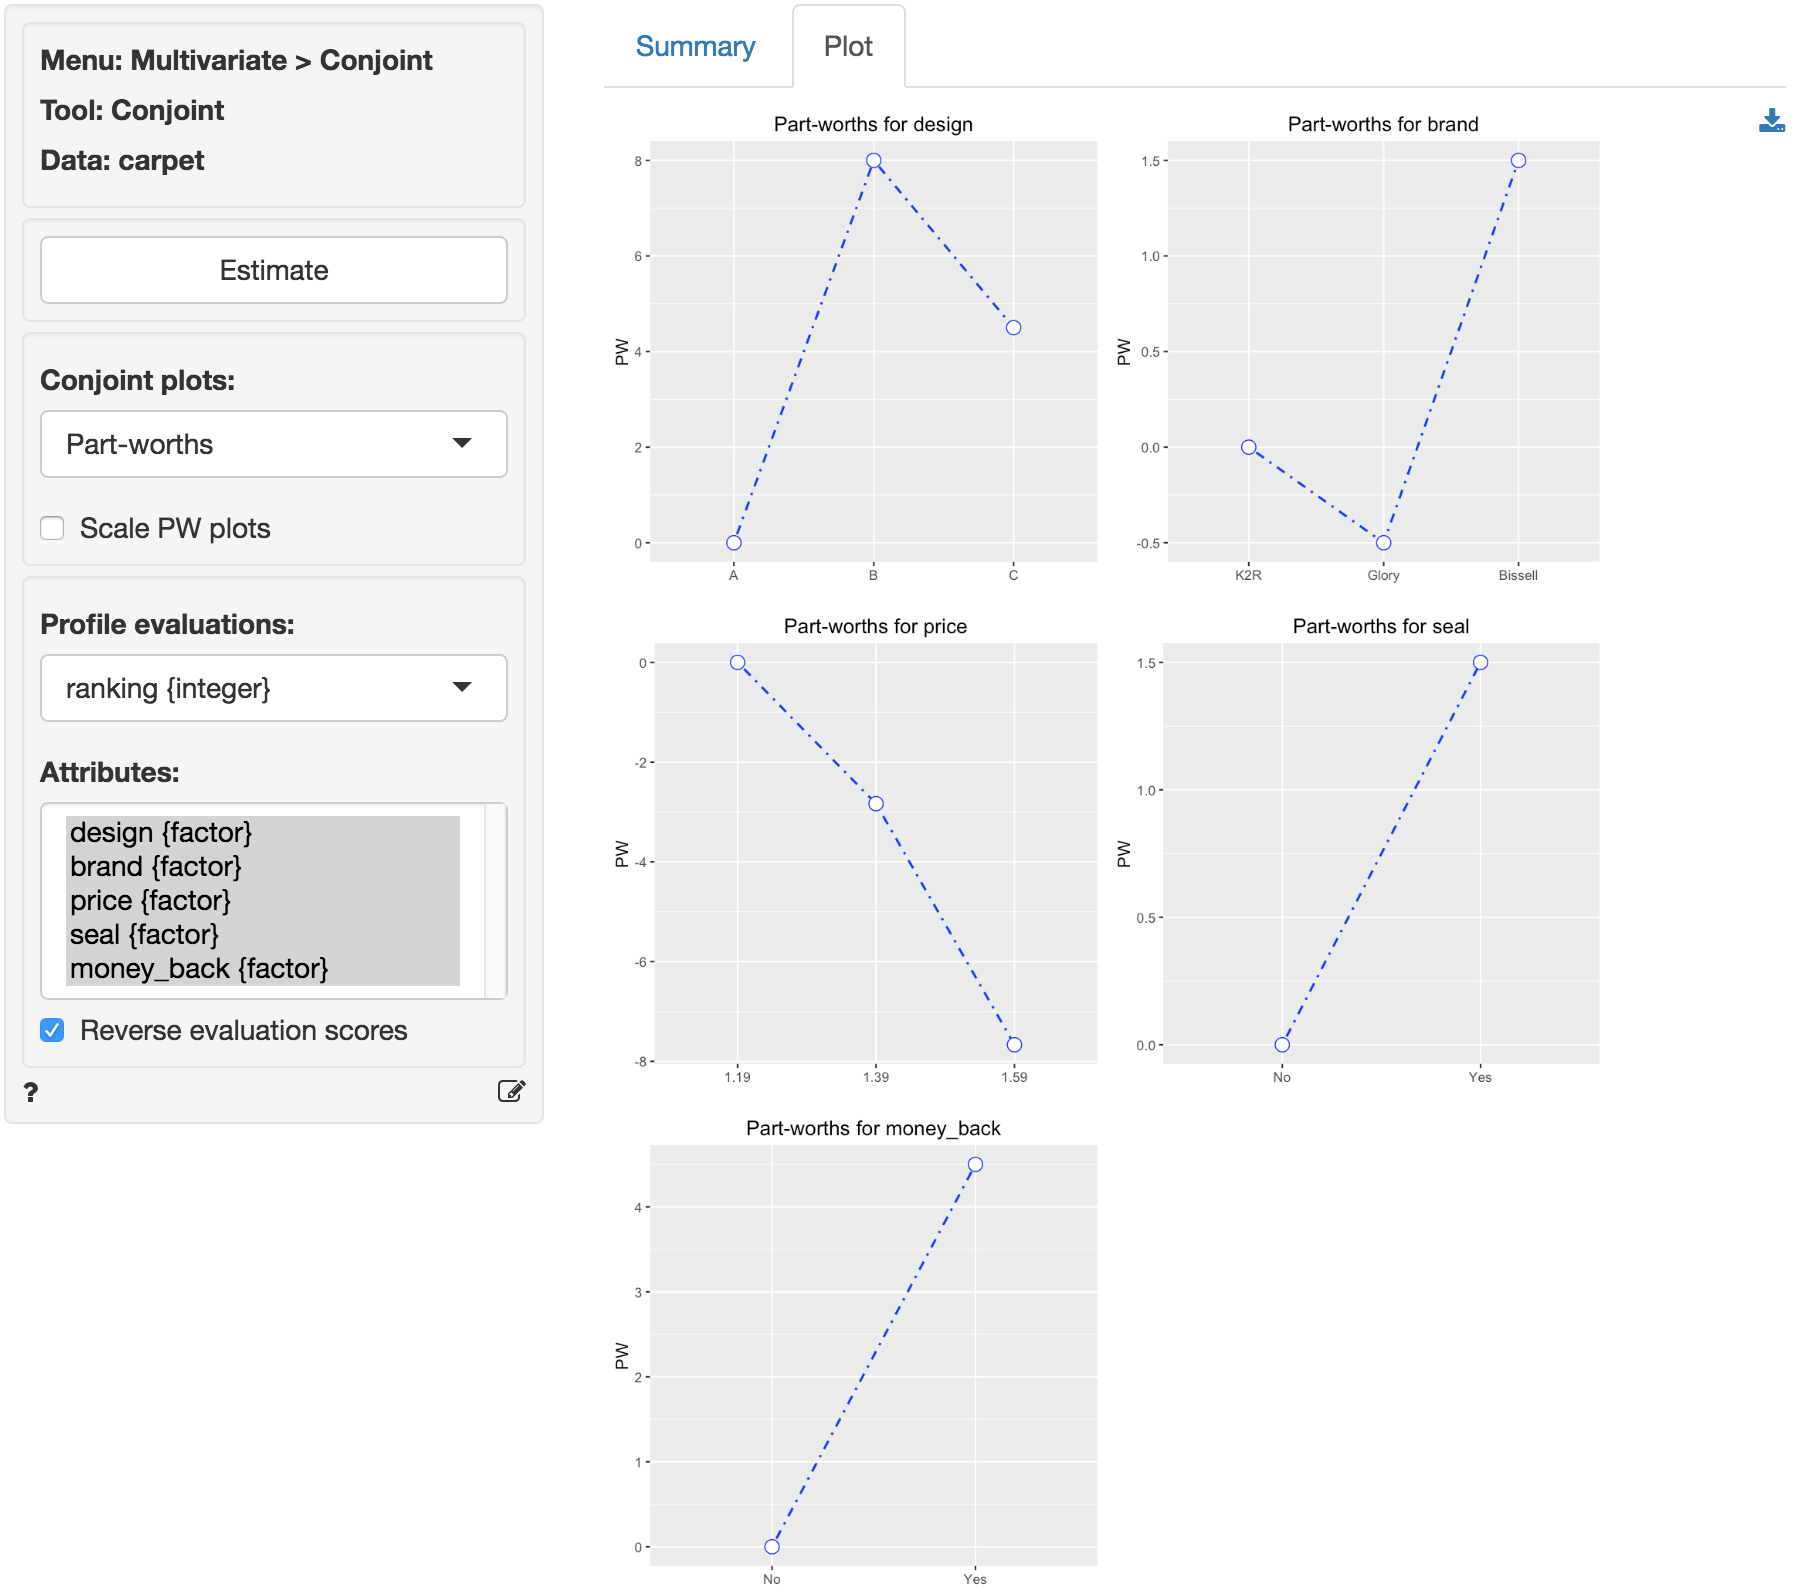
- Estimate a conjoint model using the respondent’s evaluations as the dependent variable and the attributes as the predictors. Show the complete list of part-worths and importance weights.
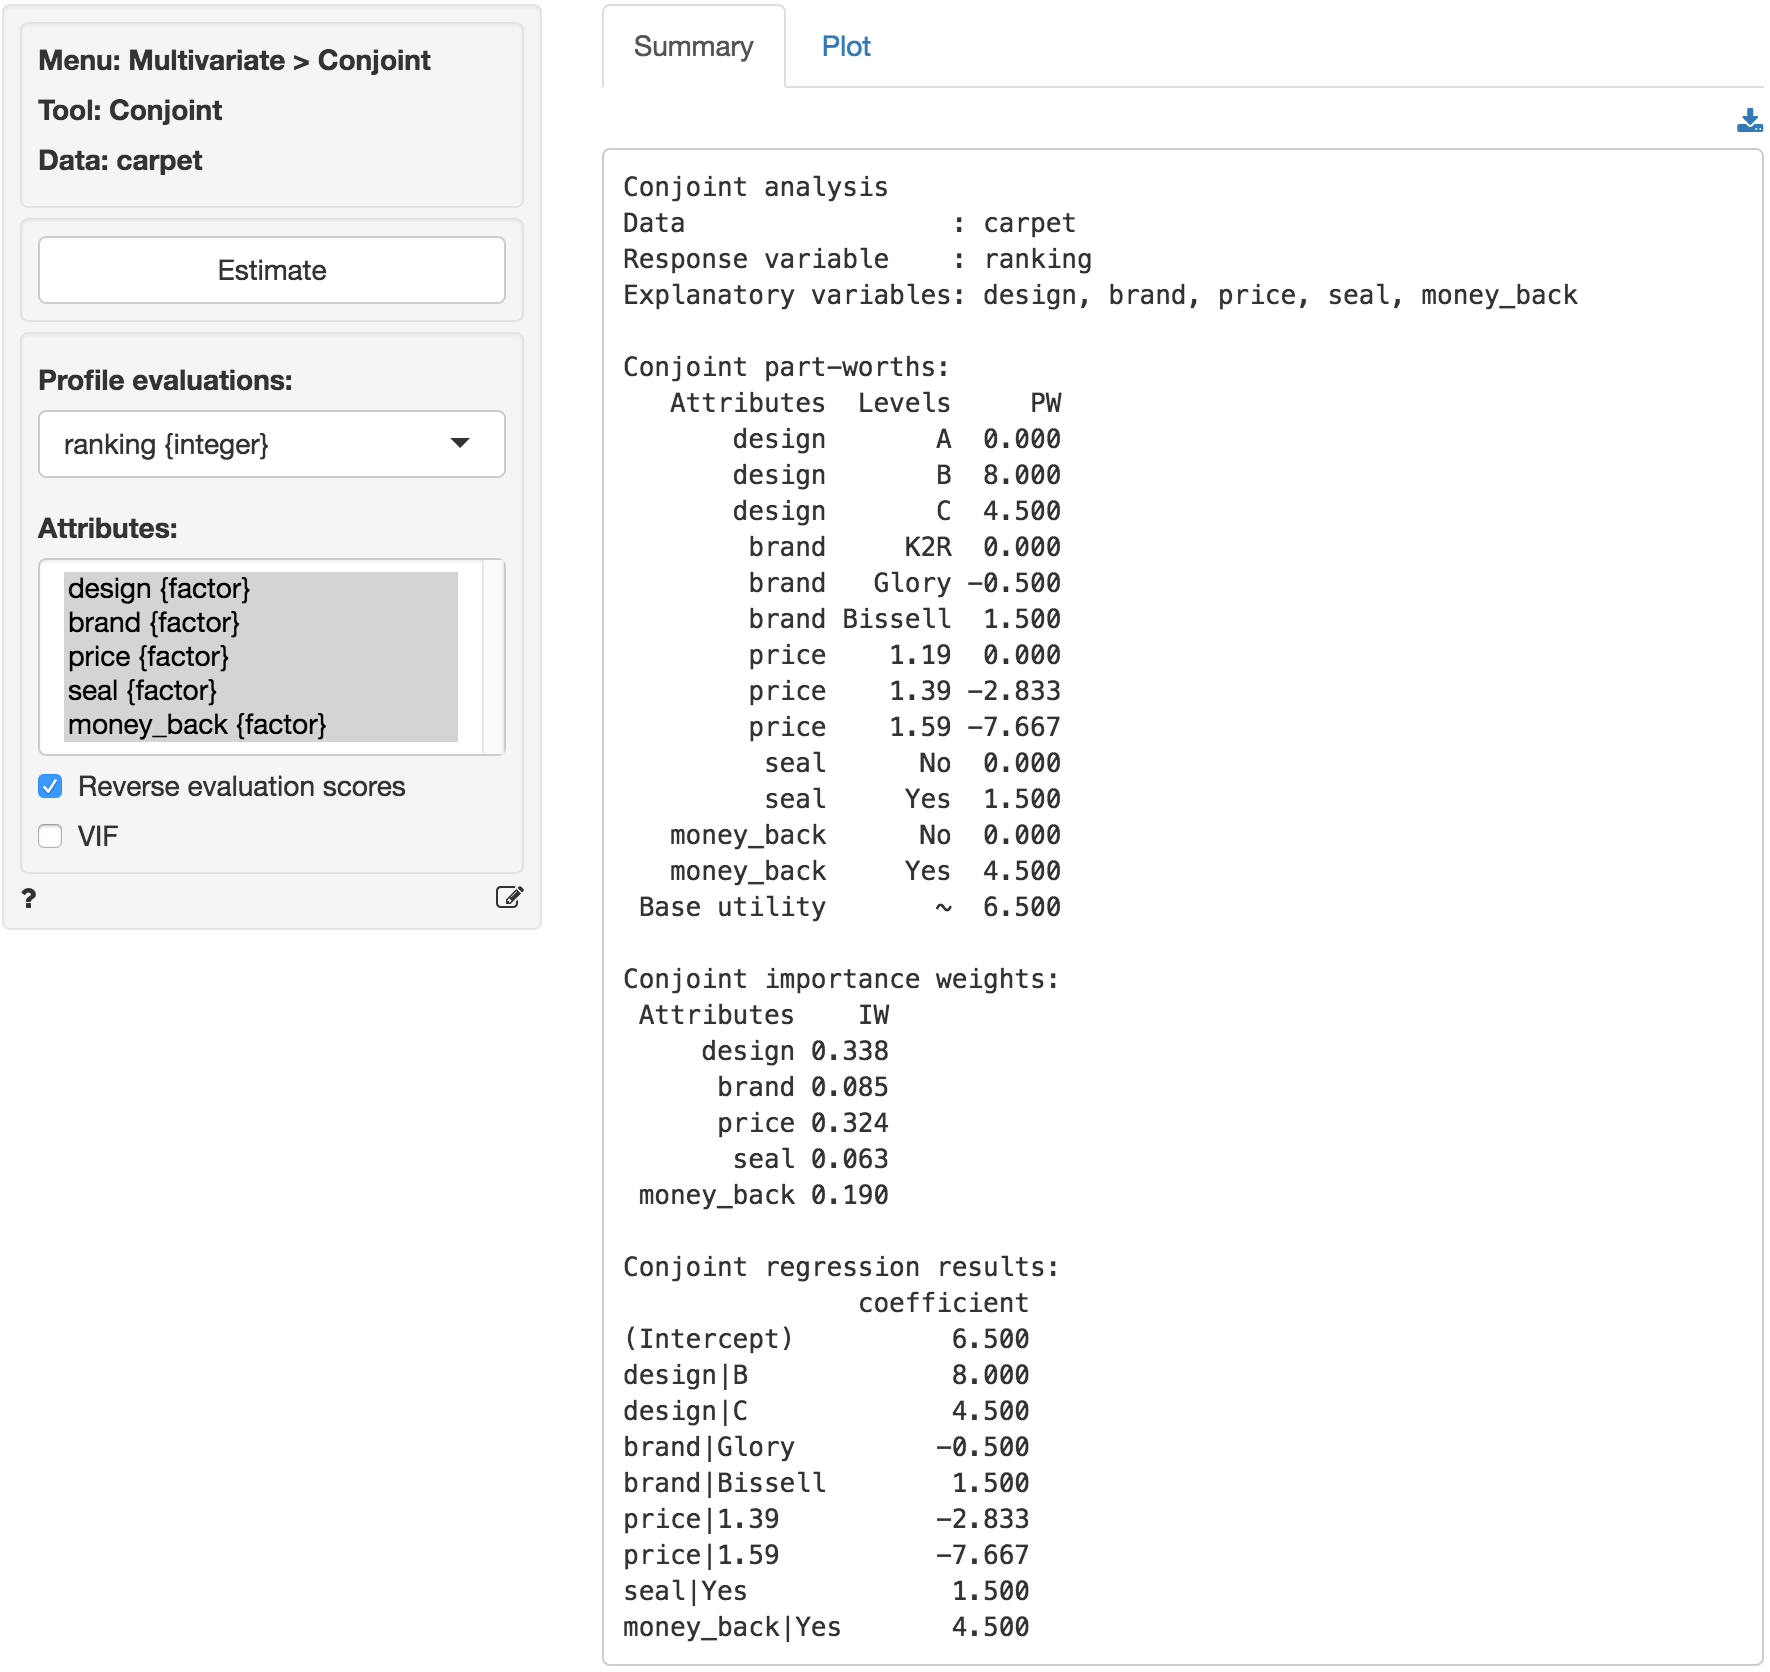
- Calculate the predicted utilities for the following options:
- Package A, K2R, $1.19, no GHKS, no MBG
- Predicted Utility based on PWs: 6.5 + 0 + 0 + 0 + 0 + 0 = 6.5
- Package C, Bissell, $1.19, no GHKS, with MBG
- Predicted Utility based on PWs: 6.5 + 4.5 + 1.5 + 0 + 4.5 = 17
- Package B, Bissell, $1.59, with GHKS, with MBG
- Predicted Utility based on PWs: 6.5 + 8.0 + 1.5 - 7.67 + 1.5 + 4.5 = 14.33
- What is the highest predicted utility that can be obtained? What are the characteristics of that option?
- The option with the highest (predicted) utility is: Package B, Bissell, $1.19, with GHKS, with MBG
- Predicted Utility based on PWs: 6.5 + 8.0 + 1.5 + 0 + 1.5 + 4.5 = 22
